>
I have the permission to use the chart at the right, because I created using data from the Budget of the United States Government, Government Printing Office (GPO).
American citizens are pretty blind when it comes to political parties, government spending, who spends more, etc. I am not immune to ignorance myself, but I try to make myself less ignorant when I can.
I spent some time over the weekend looking at budget numbers, overall revenues and spending, not on any special items. In my own life, I try to spend less than the revenue I bring in. In our political life, people think that is the basis of the Republican Party, think that is what sets apart Republicans from Democrats. I happen to think that both parties are fiscally liberal. That is, they both spend more money than the country takes in, but they spend the money differently. My hypothesis is that while they are both identical in terms of spending habits. Democrats favor Social Spending and Welfare; Republicans favor subsidies for Business and Military Spending. The two parties differ only in their approach to social issues. Republicans are socially conservative, against Same-Sex Marriage, pro-Life, pro-Religion; while Democrats are socially liberal, pro-SS Marriage, pro-Choice, pro-Diversity.
The Tea Party seems to offer a real option for those that are Fiscally Conservative and Socially Conservative. The Tea Party is currently causing turmoil within the Republican Party as they take issue with Republican spending habits. In essence, the Tea Party is illuminating the lack of spending discipline that exists within the Republican Party. Of note, this is manifesting as Tea Party members, such as Rand Raul-R (KY) support the cutting of the military budget, and militarized welfare programs, such as commissaries, PXs, and the Morale, Welfare, and Family (MWF) Command.
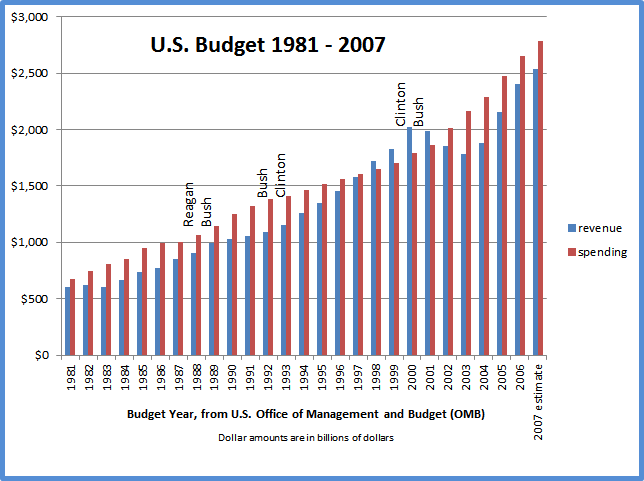
Out of curiosity, I downloaded the Excel (XLS) file that contains data for all the budget receipts and spending for years between 1950s-2008. The graph represents the revenues versus spending over a 16-yr time period from the Reagan Administration through the 3rd year of Bush II’s final term. I have noted terms of office. I have not altered or changed in any way the data. The link provided in the Title allows anyone access to the same data.
Presidents get the credit or take the blame for events or circumstances out of their control. People denigrate Pres. Carter for his apparent economic lapses. These people seem to forget that Nixon was the father of the problem, with his policy of instituting price controls that created the havoc. Carter got the blame because the bulk of the problems didn’t arrive until after Nixon left office. Carter tried to gradually remove these price controls. His days were numbered as Americans blamed him rather than the true culprit.
But the table is telling. Red is Spending, Blue is Revenue. When the Red Bar is higher than the Blue Bar, obviously we are over-spending. Republican Presidencies tend to be less budget-friendly, while Democratic Presidencies tend to be more budget-friendly. The trend is probably due to the negotiations between the party in the White House and the party in power. Also, it seems that a Democrat in the White House with a Republican Congress is better than the reverse.
Reviewing data from 1959 forward through visual inspection, only 5 years resulted in actual budget surpluses. Three of those years were essentially Clinton years, as they were the result of budget decisions during his term in office. The 2001 BY can be attributed to Bush II. However, Bush II would then go on to expand Deficit Spending more than any other president in history, and completely blow away the old record-holders of Deficit Spending, Reagan-Bush.
