One of the three course I “coach” is Introduction to Cartography. Since 2000, I’ve had the pleasure of helping guide students in the design and composition of cartographic products. Cartography has changed immensely in 13 years. Heck, a little more than two decades ago I was using pen, ink, Leroy lettering sets, mylar for composing my own maps. My first exposure to digital mapping was some program on the Apple IIe. The computer was protected in a professor’s office. We had to make an appointment to make our first digital map of Missouri. Data entry had to be done all at one sitting; there was no option to “save.” I got my first and only attempt at mapping some Missouri demographic variable wrong. Some of my Missouri counties appeared as solid black polygons, a diagnostic sign I screwed up somewhere. Therein lies my downfall. On occasion, I transpose numbers, some form of dyslexia, I suppose. Not letters, only numbers. As a kid, I was good at math and might have been better if not for my problems with transposing numbers.
My course uses a software product, ArcGIS, produced by the industry leader in geographic information systems (GIS) technology, ESRI (Environmental Systems Research Institute). Through a simply brilliant contractual agreement with ESRI, the Commonwealth of Kentucky/Council on Post-secondary Education funds ESRI licenses for the benefit of all higher education institutions in Kentucky. Kentucky takes some hard knocks around the United States, the brunt of redneck jokes, but one aspect of Kentucky which remains beyond reproach is the investment in STEM/G (where “G” is “geospatial”), and especially the “G.” The Kentucky CPE/GIS advocates are two of the best guys in the United States, and the people of the Commonwealth owe these gentlemen.
Cartography is the art and science of geography. Maps are the representation of some phenomenon distributed in space. By space, I mean literal space, from the space between you and I, to the space between our ears, to the space between our Earth and the Horsehead Nebula. Anything, any idea or object which can be tied to a point in space can be mapped. These maps can be virtual, on a computer screen or in our brains. These maps can be real, tangible, hard-copy maps printed on laserjets from virtual Google Maps, Bing Maps, OpenStreetMap, or maybe even Wikimapia.
I put my students through the ringer. If one were to interview them, I think my students might be more blunt. The tone of many of my posts – I suppose there is a tone – is certainly expressed in my courses, from what I understand. The course covers the attributes of mapping, the fundamentals of map reading, measurement, map projections, and grid and coordinate systems. My students are working towards degrees in many fields, history, journalism, archaeology, geosciences, marketing and business, wildlife biology, and geospatial technologies. They have to be exposed to all sorts of map design elements and considerations in order to be prepared for what they might run across in their first career.
Today’s cartographers also need to be graphic artists, of sorts. 21st century cartographers must be fluent in computers, RAM, hard drive capacity, graphics cards, and monitors. Network speeds, file locations, file types, and file sizes are mandatory knowledge. Knowing something about Pantone colors, color relationships to handle greyscale publishing or those with color-blindness, can also be quite important. Sometimes, other software is necessary to “clean up” cartography, or to push into the realm of “infographics.” The most common graphics software for PC/Intel use is Adobe Illustrator. Some designers may use CorelDRAW.
21st century cartographers must have knowledge of data, data management, database tables, and SQL queries. Programming in Python is always a plus for a resume.
Being a mapping professional in the 21st century can be an amazing vocation. A market analyst should definitely have some mapping skills. A historian can use mapping applications to revision historic battlefields, or help interpret the movement of people and cultures. Wildlife biologists absolutely need mapping skills perhaps merely to find a job and be employable. Businesspeople need mapping skills purely out of survival. Mapping clients, service areas, delivery zones, potential customers, current customers, location of competing and complimentary businesses contributes a better understanding of any corporation’s mission.
However, our modern Web 2.0+ technologies can turn anyone with a computer into a neophyte cartographer. While superficially cool, putting easy data and technology into the hands of unsophisticated users can be problematic. Many people aren’t schooled in data manipulation, analysis, and interpretation. Using Google Maps to develop directions to a wedding reception is one thing; mapping the distribution of sales based on some demographic trait is different.
Below are some sample work from my Spring 2013 Introduction to Cartography course. Names have been ‘redacted’ to protect the innocent 🙂


 Law enforcement is a heavy user of mapping technology. The Citation Hotspot map (below) is an example of how local city law enforcement utilizes GIS technology. Police examine citation records and locations to uncover locations of high collision incidents. Perhaps, the logic goes, people are driving too fast, too carelessly, and too inattentive. Therefore, to reduce collision rates, traffic enforcement is increased.

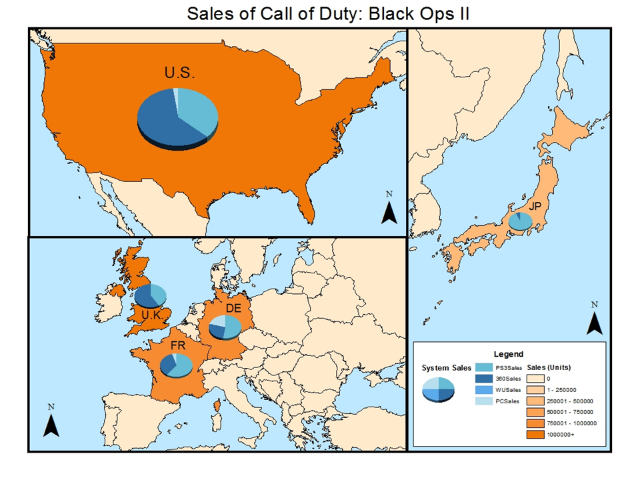 The Black Ops II map (above) and the Video Game Sales (below) were authored by two different students. About 50% of my students are very much into comic books, video games, Firefly, science fiction and fantasy, and collectible card games (CCG). Every student struggles with data management. Not every student had to struggle to obtain data, though. Some data is easy to obtain, like poverty data, or data on foster care. A considerable amount of data is accessible to the general public. Some data is not. The Video Game / CCG / Nerd / Geek Industry guards marketing and sales information as well as a Magic-User wrapped in a Sphere of Invulnerability. But, all persevered, scraping the Internet for useful statistics.

I would think Marvel, DC, Wizards of the Coast, Image, Dark Horse, AE, Microsoft (XBox), Sony (PS3), and Nintendo would all love to see detailed maps of their respective users, their market penetration, where games sell and where they don’t. Games makers should map their sales; perhaps some games sell better in some areas while other games sell better in others. Perhaps Captain America is more popular in the Midwest than in the Northwest. Certainly sales data by location exists. Mapping this data would not only be a wonderful learning experience of students but the payoff for publishers of video games and comics is the artists, writers, and programmers get to “see” where there games are played.
Of course, I’m sure players of MMORPGs are already being mapped. But, what is being gleaned from this knowledge? Is the knowledge being used to evaluate users, research location and activity. Is there any interpretation of the data? Many of my students would like to know.
 At the ends of the semester, each student presents the fruits of their labors to the course. Each student reviews the work of their peers. Peer review results I compile and aggregate in order to create anonymous reports then submit back to each student a summary report in order for them to have feedback.
